Self-hosted monitoring for your entire infrastructure

Pulse brings Proxmox, Docker, Kubernetes, TrueNAS and vSphere into a single self-hosted workspace, with a page for every platform and alerts that tell you the moment something breaks.

Free and open source, no account required. Paid plans start at $39/year for remote access.
Starred by 6,100+ developers on GitHub

Covered by XDA Developers VirtualizationHowto 45HomeLab
Pulse dashboard showing the unified platform overview
The workspace

A page for every platform

Proxmox, Docker, Kubernetes, TrueNAS, vSphere and standalone machines each get their own view, in the shape operators already know. Storage and recovery live on the platform pages they belong to.

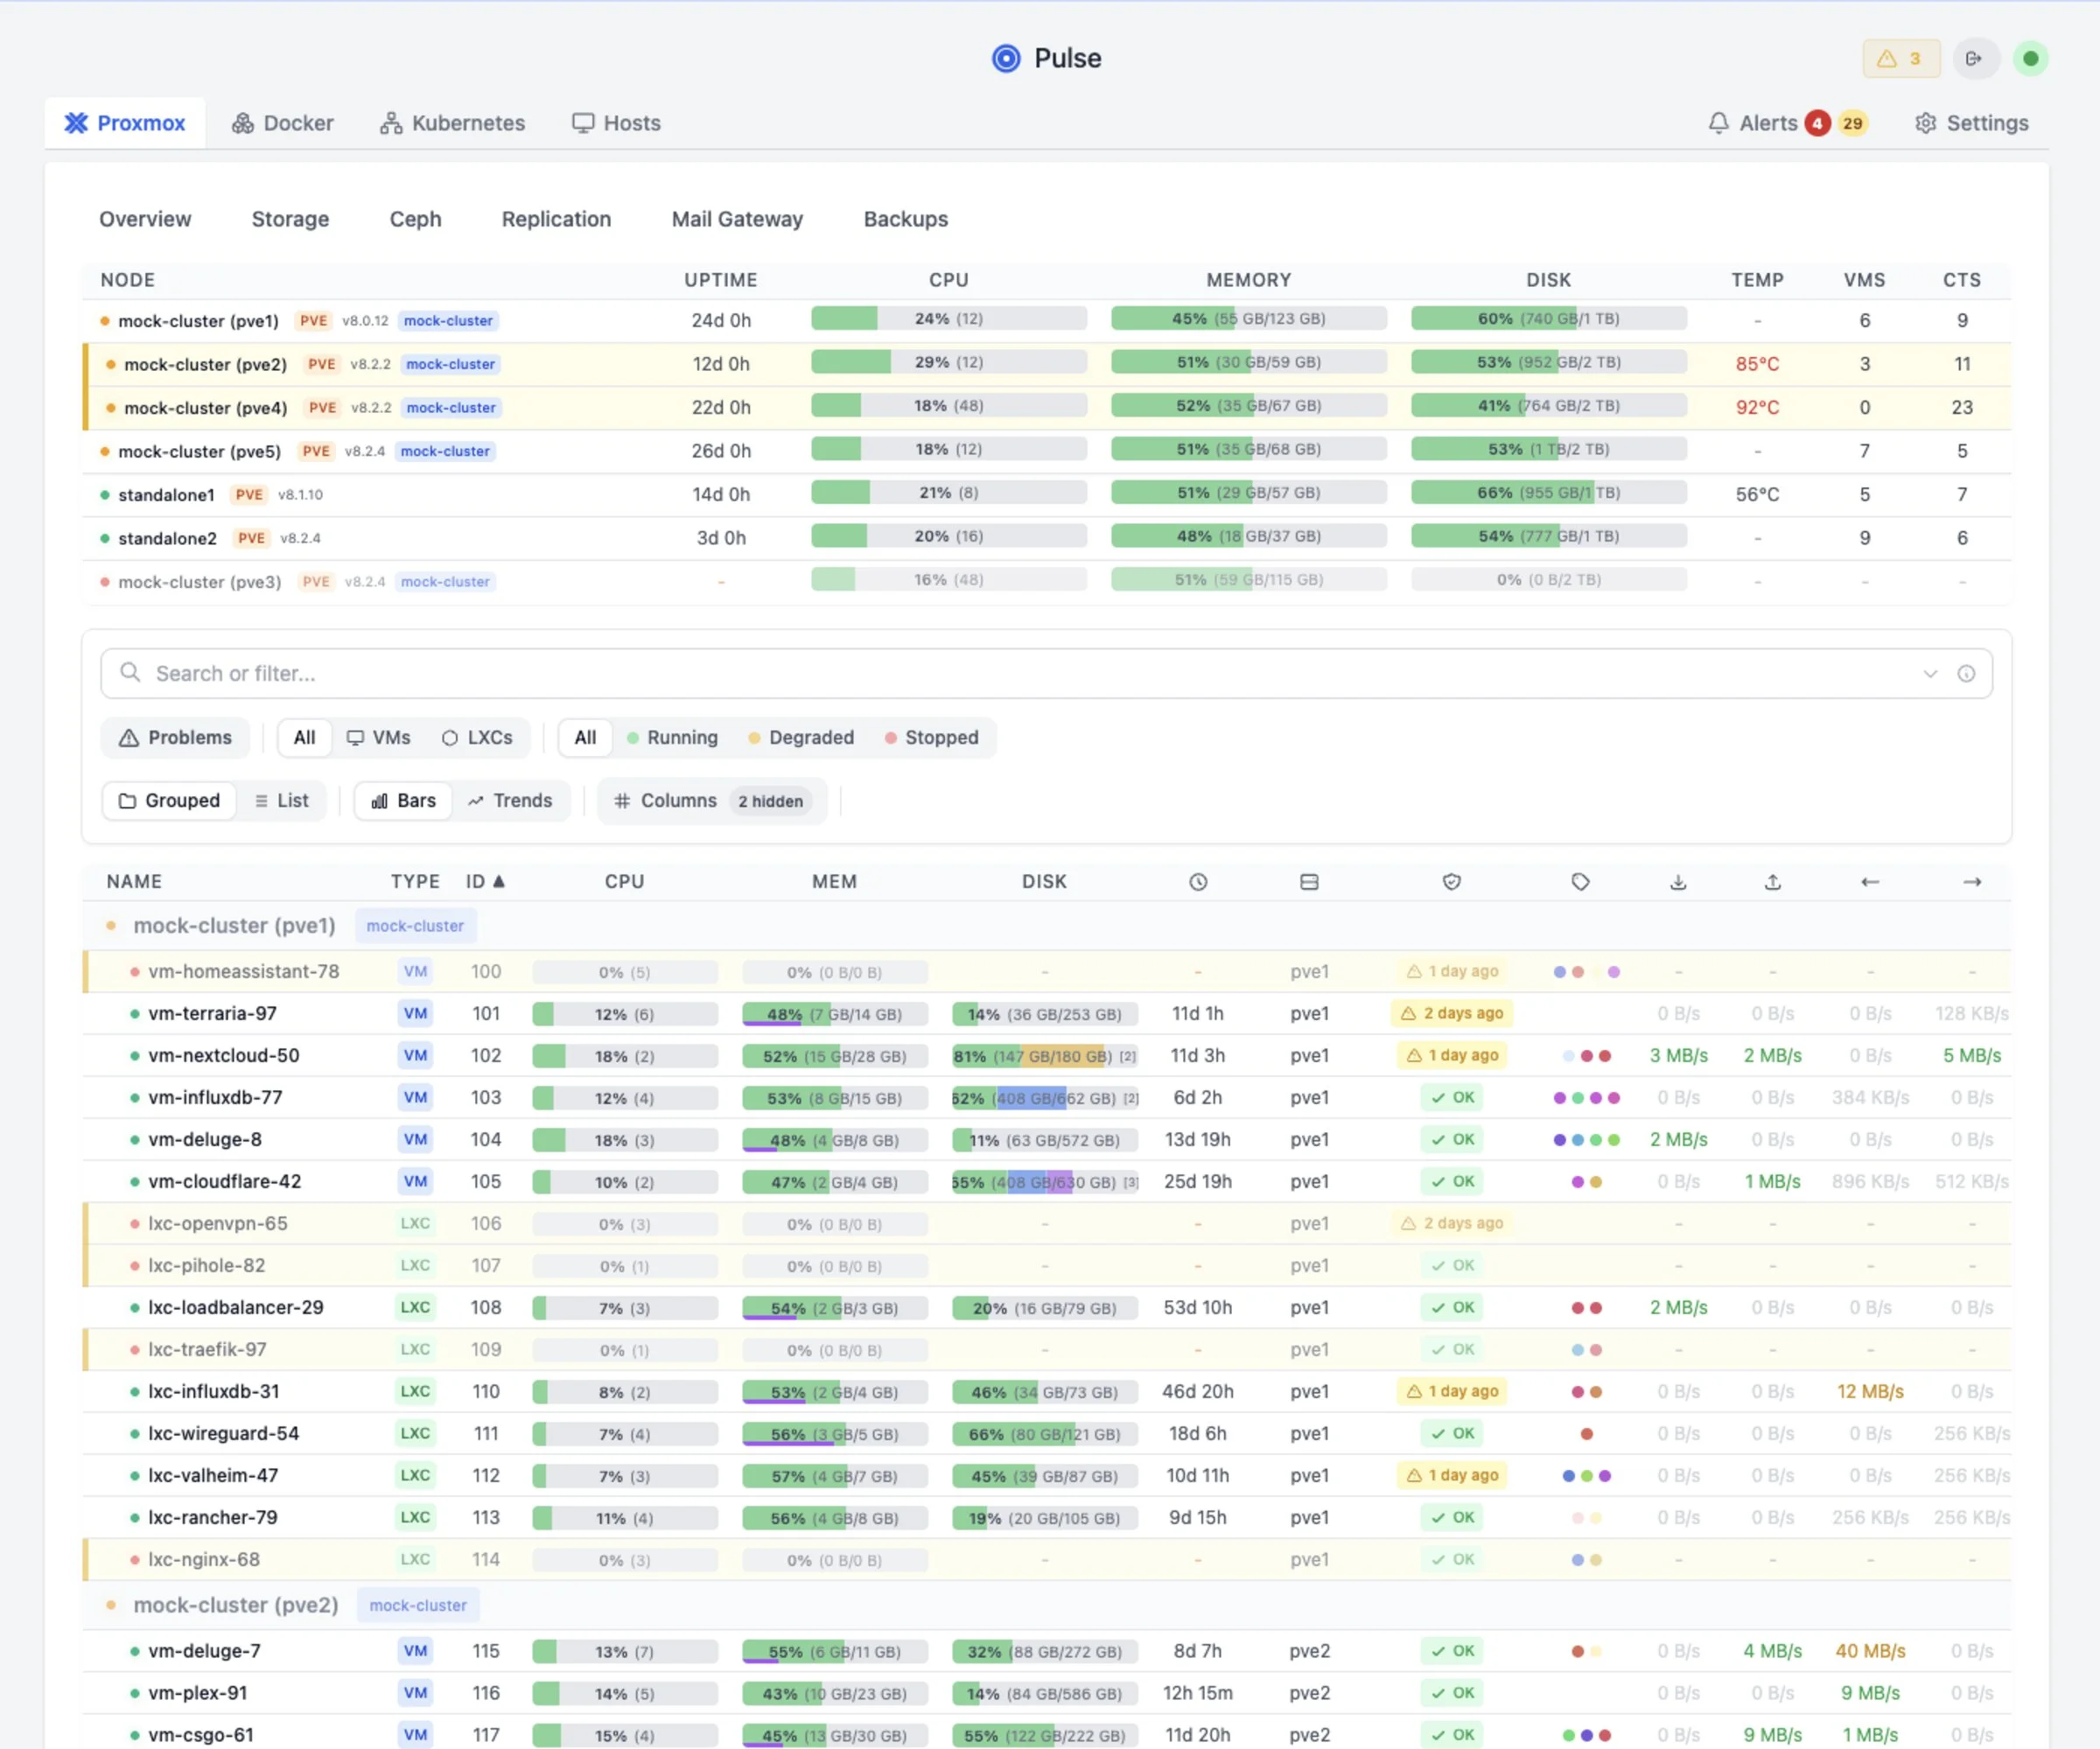
Pulse Proxmox view showing eight nodes and the guest table with per-VM CPU, memory, disk and I/O
Nodes, VMs and LXC in one table. Filter, group and sort by anything, or hit / to search.

Alerts that stop flapping

Adaptive, hysteresis-based thresholds instead of a bare number, so a VM sitting on the line doesn't mail you forty times. Delivered to Discord, Slack, Telegram, email and more.

Recovery you can actually check

Backup, snapshot and replication history for PBS, ZFS and TrueNAS, and vSphere, on the platform page it belongs to. The job that quietly stopped running is visible.

History and trends

Persistent metrics with configurable retention, so you can answer whether this is new or whether it has been creeping for a month.

Built to be driven fast

g p for Proxmox, g d for Docker, g a for Alerts, Cmd+K for the command palette.

Coverage

What Pulse connects to

Proxmox is read over the API with no agent at all. Everything else uses one binary that works out what is running on the host by itself.

Proxmox VE, PBS and PMG

  • Nodes, VMs, LXC and OCI containers on 9.1+
  • Backup jobs, datastores and verification from PBS
  • Mail gateway queues and counters from PMG
  • Auto-discovery of nodes on your network

Docker and Podman

  • Container state, health checks and restarts
  • Swarm services and their roles
  • Per-host CPU, memory, disk and uptime
  • Detected automatically by the agent

Kubernetes

  • Cluster nodes and workloads
  • Pod-level resource usage
  • Sits next to your other platforms, not in a silo

TrueNAS and ZFS

  • Pools, datasets and individual disks
  • ZFS snapshots and replication tasks
  • TrueNAS alerts surfaced alongside your own

vSphere

  • Clusters, hosts and virtual machines
  • Snapshot and recovery history
  • Same resource model as everything else

Ceph and standalone hosts

  • Ceph cluster health next to the nodes using it
  • Any Linux, Windows or macOS box as a machine
  • Synology included
Reviews

What people say after installing it

"I set it up for the first time yesterday and was impressed by the simplicity and ease of setup [...] I was up and monitoring in a few minutes. The fact that you can monitor docker as well is just icing on the cake!"

@Radixb on GitHub

"Setup Wizard - Easy as can be! Love it! Upgrade was super easy no issues at all."

@faustus1005, Pulse 5.0 release candidate testing

"Thank you very much for the quick handling of my ticket and for implementing the requested feature so fast. That kind of responsiveness is rare and highly appreciated. Pulse is an excellent tool"

@prueckls on GitHub

"Your repository is probably the only GitHub I know where Issues are closed this quick."

@hughfr4nc15 on GitHub
In the press

"This is hands-down the best monitoring utility for Proxmox"

Pulse Patrol

The rounds you keep meaning to do

Alerts catch the things you thought to write a rule for. Patrol goes looking for the rest on a schedule: capacity creep, backups that stopped working months ago, drift between nodes. Findings come free with every install, using your own LLM key or a local model.

ZFS pool "tank" 94% full

At current growth rate, pool will be full in 3 days. ZFS performance degrades significantly above 80%.

→ Run `zfs list -o space`
VM 105 restarting loop

6 unexpected reboots in the last 24 hours. Memory usage spikes to 98% before each restart.

→ Check memory allocation
Backup job silent fail

"nightly-backup" last succeeded on Dec 18. VM 102 (postgres) has no recent protection.

→ Check PBS storage

Patrol can also do something about it

On Pro, Patrol investigates each alert the moment it fires, works out which alerts are symptoms of the same root cause, proposes the exact command, and runs it only under the approval policy you choose. Every action is verified and logged.

How Patrol works →
Pricing

Self-hosted Pricing

Choose the self-hosted plan that fits your setup.

Secure checkout by Stripe
License available immediately after payment
14-day money-back guarantee
Setup

Up and running in minutes

1

Deploy Pulse

Docker or LXC. Add your Proxmox API credentials.

docker run -d --name pulse -p 7655:7655 -v pulse_data:/data -e PULSE_DEPLOYMENT_METHOD=docker_run --restart unless-stopped rcourtman/pulse:latest
2

Connect your infrastructure

Proxmox needs API credentials and nothing else. Everything else gets the one-line agent.

Settings → Infrastructure
3

Add an LLM key optional

Only needed for Patrol and the assistant. OpenAI, Anthropic, Gemini or local Ollama. Monitoring works without it.

Settings → Pulse Intelligence

Prefer a Proxmox LXC, or want the signature-verified installer? Both are on GitHub.

FAQ

Common Questions

Can I use my own LLM? +
Yes! Pulse supports OpenAI, Anthropic Claude, Google Gemini, and local Ollama. Your data stays on your infrastructure. We never see it.
What's the refund policy? +
14-day money-back guarantee, no questions asked. If it's not for you, we'll refund you immediately. MSP plans get 30 days, because a provider deployment takes longer to stand up and evaluate.
What's the difference between Community, Relay, and Pro? +
Community watches your infrastructure locally and includes Patrol findings with your own LLM key. Relay adds secure access, so you can reach the Pulse web UI from anywhere, pair Pulse Mobile, and get push notifications, with 14-day history. Pro puts Patrol to work. It investigates issues, applies safe fixes in the mode you choose (Ask first, Safe auto-fix, or Autopilot), and verifies the result, with 90-day history. Pro includes Relay connectivity plus RBAC, audit logging, reporting, and agent profiles for teams.
I already run Tailscale. Do I need Relay? +
For reaching the web UI, probably not. If you're happy running a VPN or a tunnel you already have a way in, and Community stays free whether you use one or not. Relay exists for the parts a VPN doesn't cover. It's how Pulse Mobile pairs with your server, and it's what delivers push notifications when something breaks, so you find out without opening anything first. It also means no client on every device you want to check Pulse from, and nothing on your network exposed. If none of that is worth $39 a year to you, stay on Community. It isn't a crippled tier.
Does it work offline / air-gapped? +
Pulse Community's core monitoring runs locally and can remain offline after setup; use Ollama for local AI. Relay, Pro, and Business require activation and periodic HTTPS access to license.pulserelay.pro to keep paid features active. Relay remote access and push notifications also require connectivity.

Stop trading your evenings and weekends for uptime.